QUERY: SQL inside Google Sheets
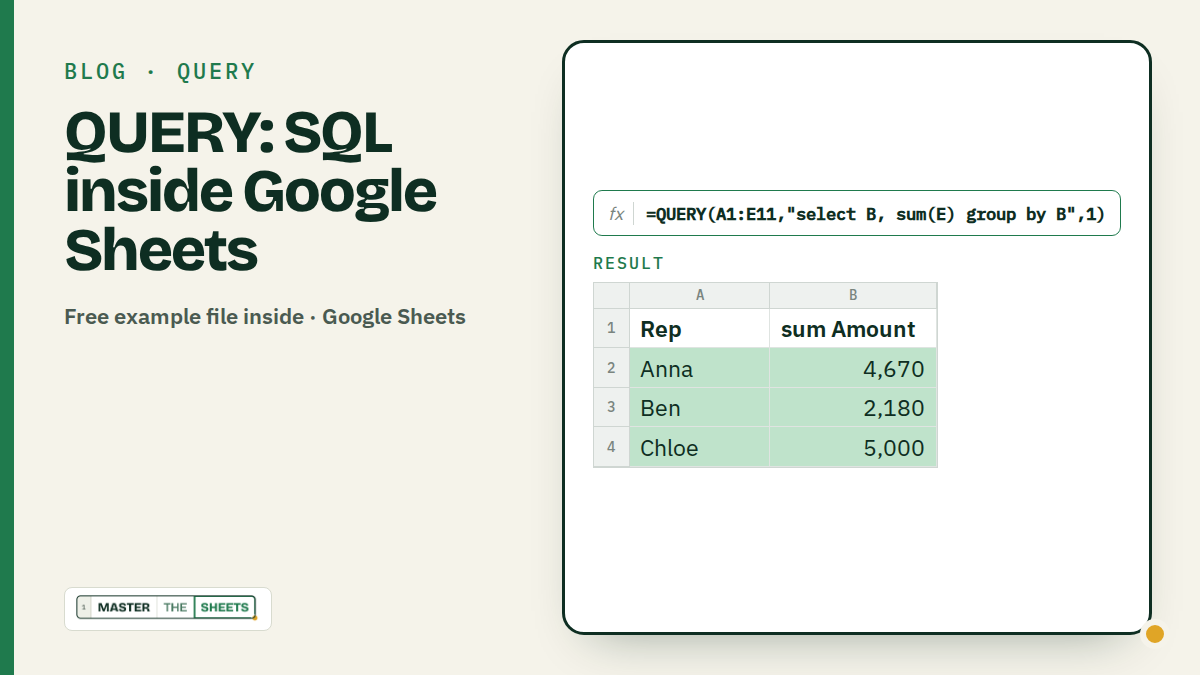
QUERY lets you ask your data a question in one cell, SQL style: =QUERY(A1:E11,"select B, sum(E) group by B",1) gives total sales per rep. It filters, sorts, groups and renames in one formula, and it works in Google Sheets only.
Are you lucky enough to understand the lines of SQL?
If yes, you will be glad to know it can also be super useful in spreadsheets. If not, this can be a good first impression of the world of queries.
With the QUERY function you can interactively filter datasets and SELECT results based on sophisticated criteria.
I am not going to lie: if you have reached this point in your Excel journey, you have probably spent long hours over heavy numbers.
Here are some useful cases for the QUERY function.
How QUERY works
=QUERY(data, query, [headers])- data: the range to ask, headers included (e.g.
A1:E11). - query: the question, written in quotes, in Google's query language (a small cousin of SQL).
- headers (optional): how many header rows your data has. Use 1. Leave it out and Sheets guesses.
Inside the query, columns are called by their letter (A, B, C…), and the clauses always go in this order:
select … where … group by … pivot … order by … limit … offset … label … formatYou don't need all of them. Most queries use two or three. Two quoting rules cover 90% of the errors: the whole query sits in "double quotes", and text inside it sits in 'single quotes'.
1. Pick only the columns you need
A small software company logs every deal: date, rep, region, plan and amount. The same 10 rows are used in every example below.
| A: Date | B: Rep | C: Region | D: Plan | E: Amount | |
|---|---|---|---|---|---|
| 2 | 4 Aug 2026 | Anna | North | Basic | 450 |
| 3 | 12 Aug 2026 | Ben | South | Pro | 1,200 |
| 4 | 19 Aug 2026 | Chloe | North | Pro | 1,350 |
| 5 | 27 Aug 2026 | Ben | West | Basic | 500 |
| 6 | 2 Sep 2026 | Anna | South | Pro | 1,100 |
| 7 | 8 Sep 2026 | Chloe | West | Team | 2,400 |
| 8 | 15 Sep 2026 | Anna | North | Team | 2,600 |
| 9 | 21 Sep 2026 | Ben | North | Basic | 480 |
| 10 | 24 Sep 2026 | Chloe | South | Pro | 1,250 |
| 11 | 29 Sep 2026 | Anna | West | Basic | 520 |
Your manager only wants date, rep and amount:
=QUERY(A1:E11,"select A, B, E",1) → 10 rows: Date, Rep, AmountYou can also reorder: "select E, B" puts the amount first. The original data never changes; QUERY builds a new table wherever you type it.
2. Keep only the rows you want (where)
Deals over $1,000:
=QUERY(A1:E11,"select A, B, E where E > 1000",1) → 6 rowsNorth region and over $1,000 (text goes in single quotes, conditions join with and):
=QUERY(A1:E11,"select A, B, C, E where C = 'North' and E > 1000",1)
→ Date          Rep     Region   Amount
  19 Aug 2026   Chloe   North    1,350
  15 Sep 2026   Anna    North    2,600
or works too: where C = 'North' or C = 'West'. So does where B contains 'An' for partial text.
3. Sort it and keep the top 3 (order by, limit)
Who closed the biggest deals?
=QUERY(A1:E11,"select B, D, E order by E desc limit 3",1)
→ Rep     Plan   Amount
  Anna    Team   2,600
  Chloe   Team   2,400
  Chloe   Pro    1,350
desc sorts biggest first, asc (the default) smallest first. limit 3 keeps the top three rows.
4. Totals per rep (group by + sum) with nicer headers (label)
This is where QUERY earns its place: a summary table in one formula, no pivot table.
=QUERY(A1:E11,"select B, sum(E) group by B order by sum(E) desc",1)
→ Rep     sum Amount
  Chloe   5,000
  Anna    4,670
  Ben     2,180
"sum Amount" is not a pretty header. label renames it, and you can count the deals at the same time:
=QUERY(A1:E11,"select B, sum(E), count(E) group by B order by sum(E) desc label sum(E) 'Total', count(E) 'Deals'",1)
→ Rep     Total   Deals
  Chloe   5,000   3
  Anna    4,670   4
  Ben     2,180   3
Other aggregates: avg, min, max, count. Every column in select that is not aggregated must be in group by.
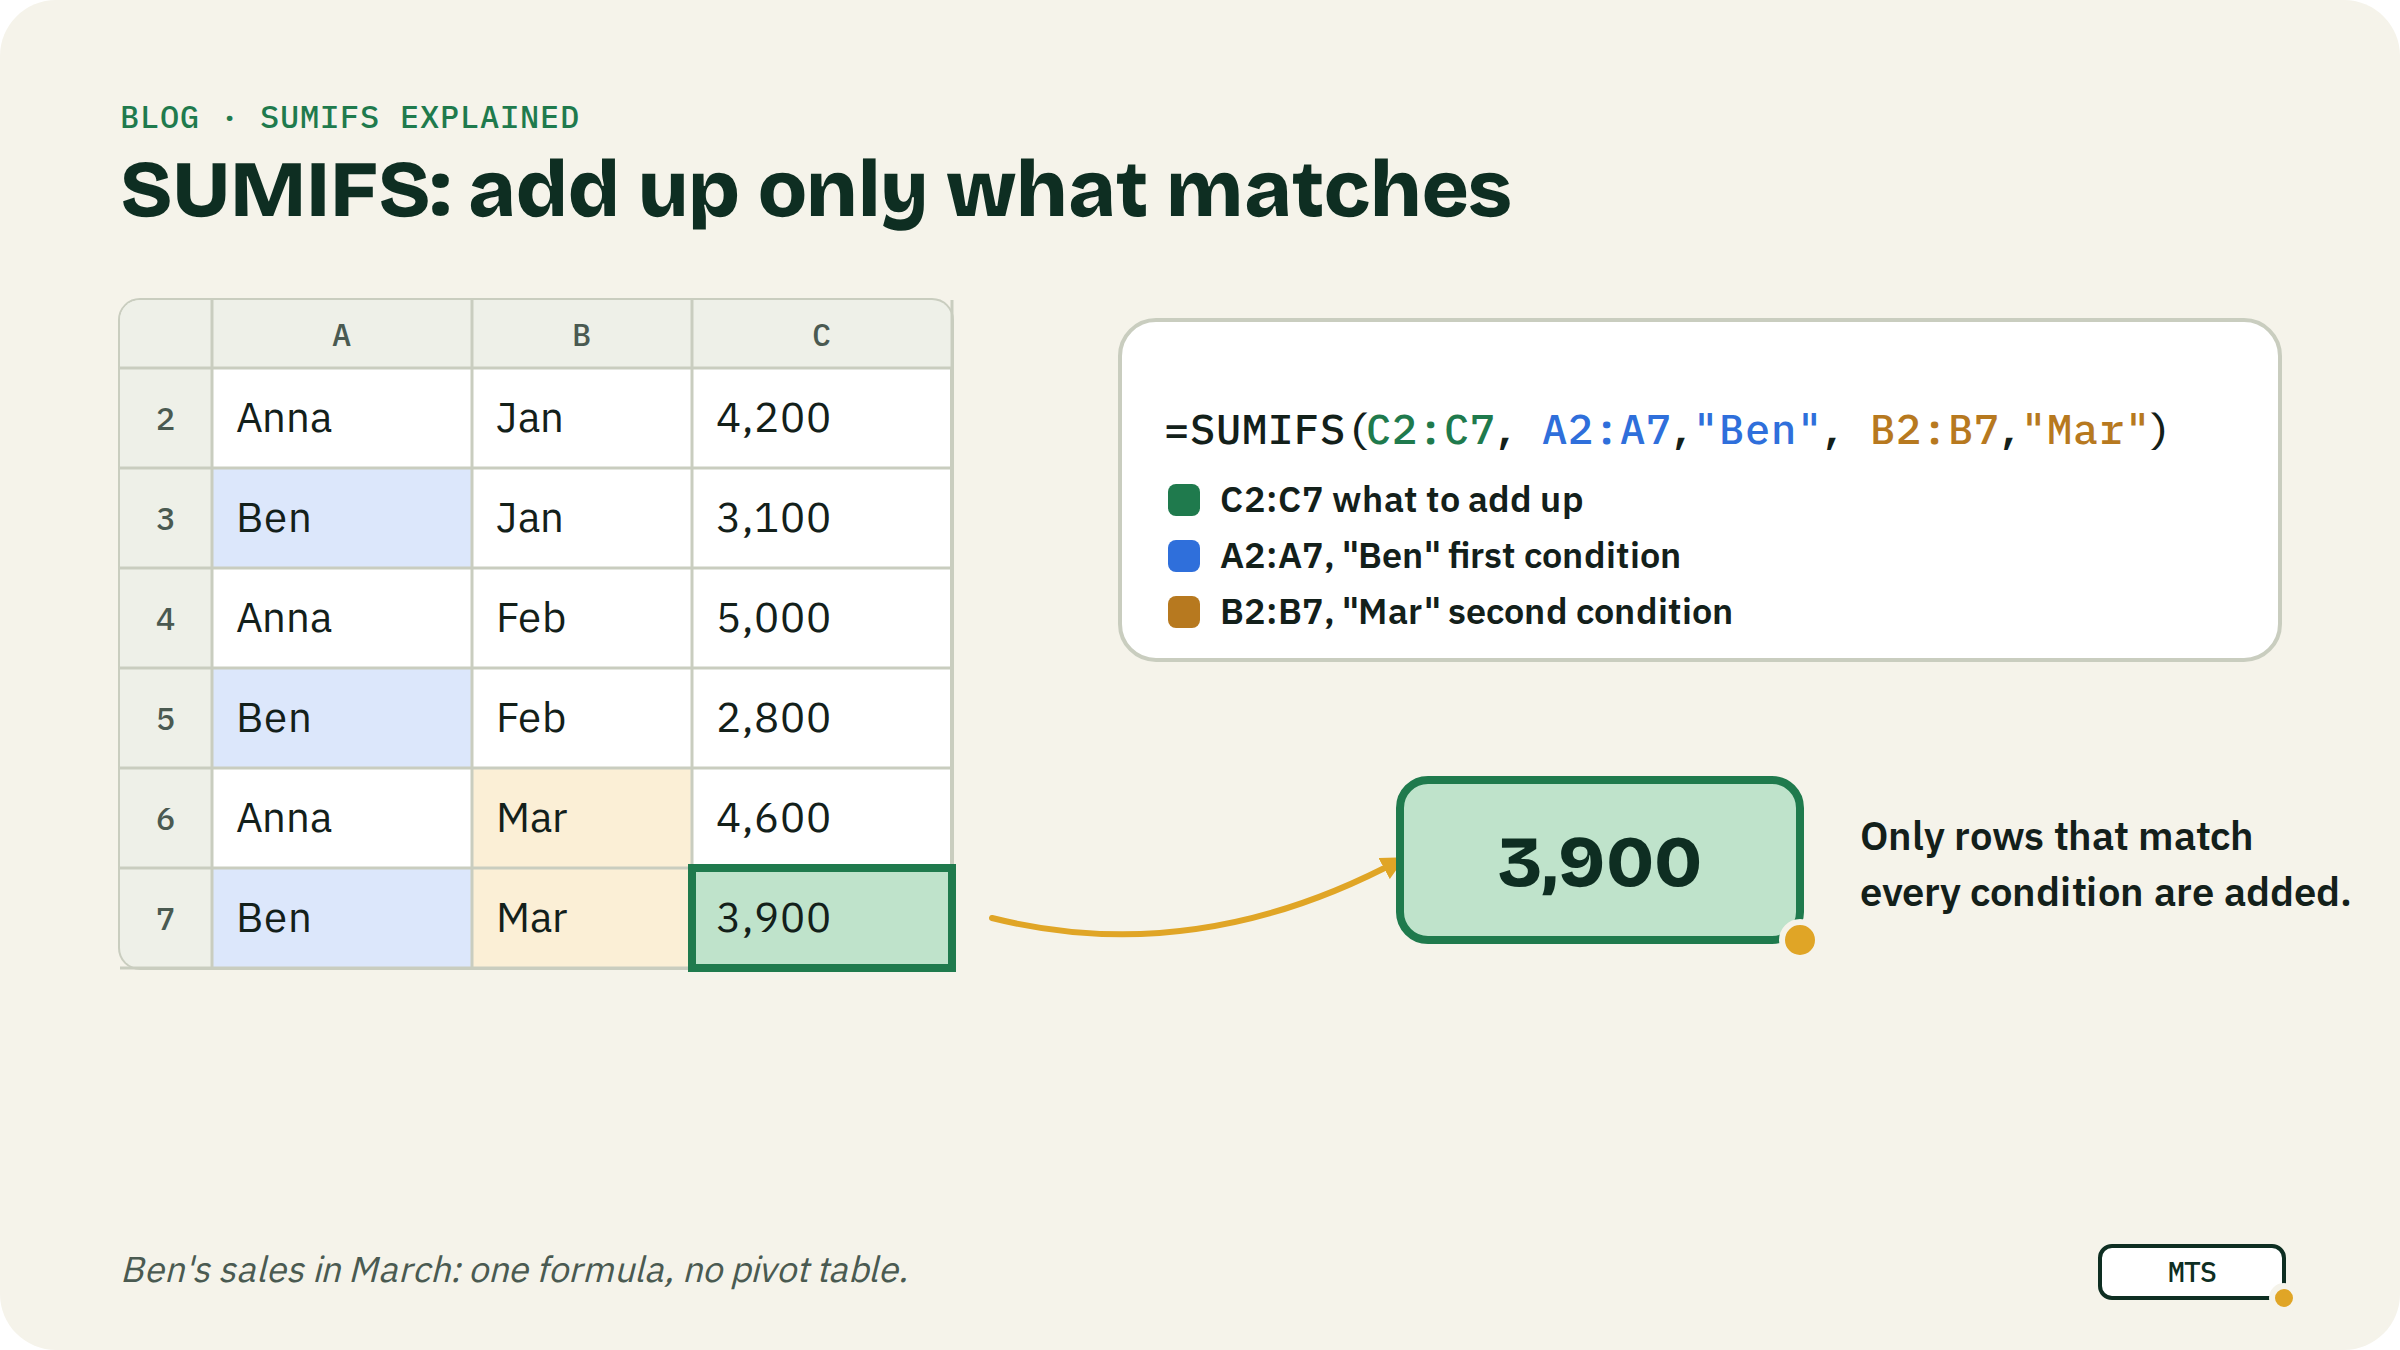
Pro tip: want one number with no header? Label it with nothing: =QUERY(A1:E11,"select sum(E) where C = 'North' label sum(E) ''",1) → 4,880. Check it with =SUMIFS(E2:E11,C2:C11,"North") → 4,880.
5. Filter by date
Dates are the one place QUERY is picky. You must write the word date and then the date as 'yyyy-mm-dd' in single quotes.
September deals only:
=QUERY(A1:E11,"select A, B, E where A >= date '2026-09-01' and A < date '2026-10-01'",1) → 6 rowsSeptember total:
=QUERY(A1:E11,"select sum(E) where A >= date '2026-09-01' and A < date '2026-10-01'",1)
→ sum Amount
  8,350
"On or after 1 September and before 1 October" catches the whole month, whatever the last day is. Same total with SUMIFS: =SUMIFS(E2:E11,A2:A11,">="&DATE(2026,9,1),A2:A11,"<"&DATE(2026,10,1)) → 8,350.
6. Let a cell drive the query (the & trick)
Typing 'North' into the formula every time gets old. Put the region in G2 and the start date in H2, then glue them into the query text with &.
| G: Region | H: From date | |
|---|---|---|
| 2 | North | 1 Sep 2026 |
=QUERY(A1:E11,"select A, B, E where C = '"&G2&"'",1) → 4 rows (North)Look closely at the quotes: '"&G2&"' is a single quote, then a double quote to close the text, &G2& to add the cell, a double quote to reopen the text, and a single quote to close the value.
Dates from a cell need TEXT to turn them into the 'yyyy-mm-dd' shape:
=QUERY(A1:E11,"select B, sum(E) where C = '"&G2&"' and A >= date '"&TEXT(H2,"yyyy-mm-dd")&"' group by B",1)
→ Rep    sum Amount
  Anna   2,600
  Ben    480
Add a dropdown to G2 (Data > Data validation) and you have a mini report anyone can use.
Common mistakes
- Double quotes inside the query. Text values need 'single quotes':
where C = 'North'. Double quotes end the query text early and you get a parse error. - Clauses in the wrong order.
order bybeforegroup byfails. Stick to select, where, group by, order by, limit, label. - Dates without the date keyword.
where A > '2026-09-01'doesn't work on a date column, and neither doesDATE(2026,9,1)inside the query. Writewhere A > date '2026-09-01'. - Mixed types in one column. QUERY decides each column's type from the majority of its values. A few numbers stored as text in the Amount column get treated as empty.
- No room to spill. QUERY returns a table. If cells below or to the right are not empty, you get #REF!.
FAQ
Is QUERY the same as SQL? Close, but smaller. It has select, where, group by, pivot, order by, limit and label, but no joins. Columns are letters (A, B, C), not names.
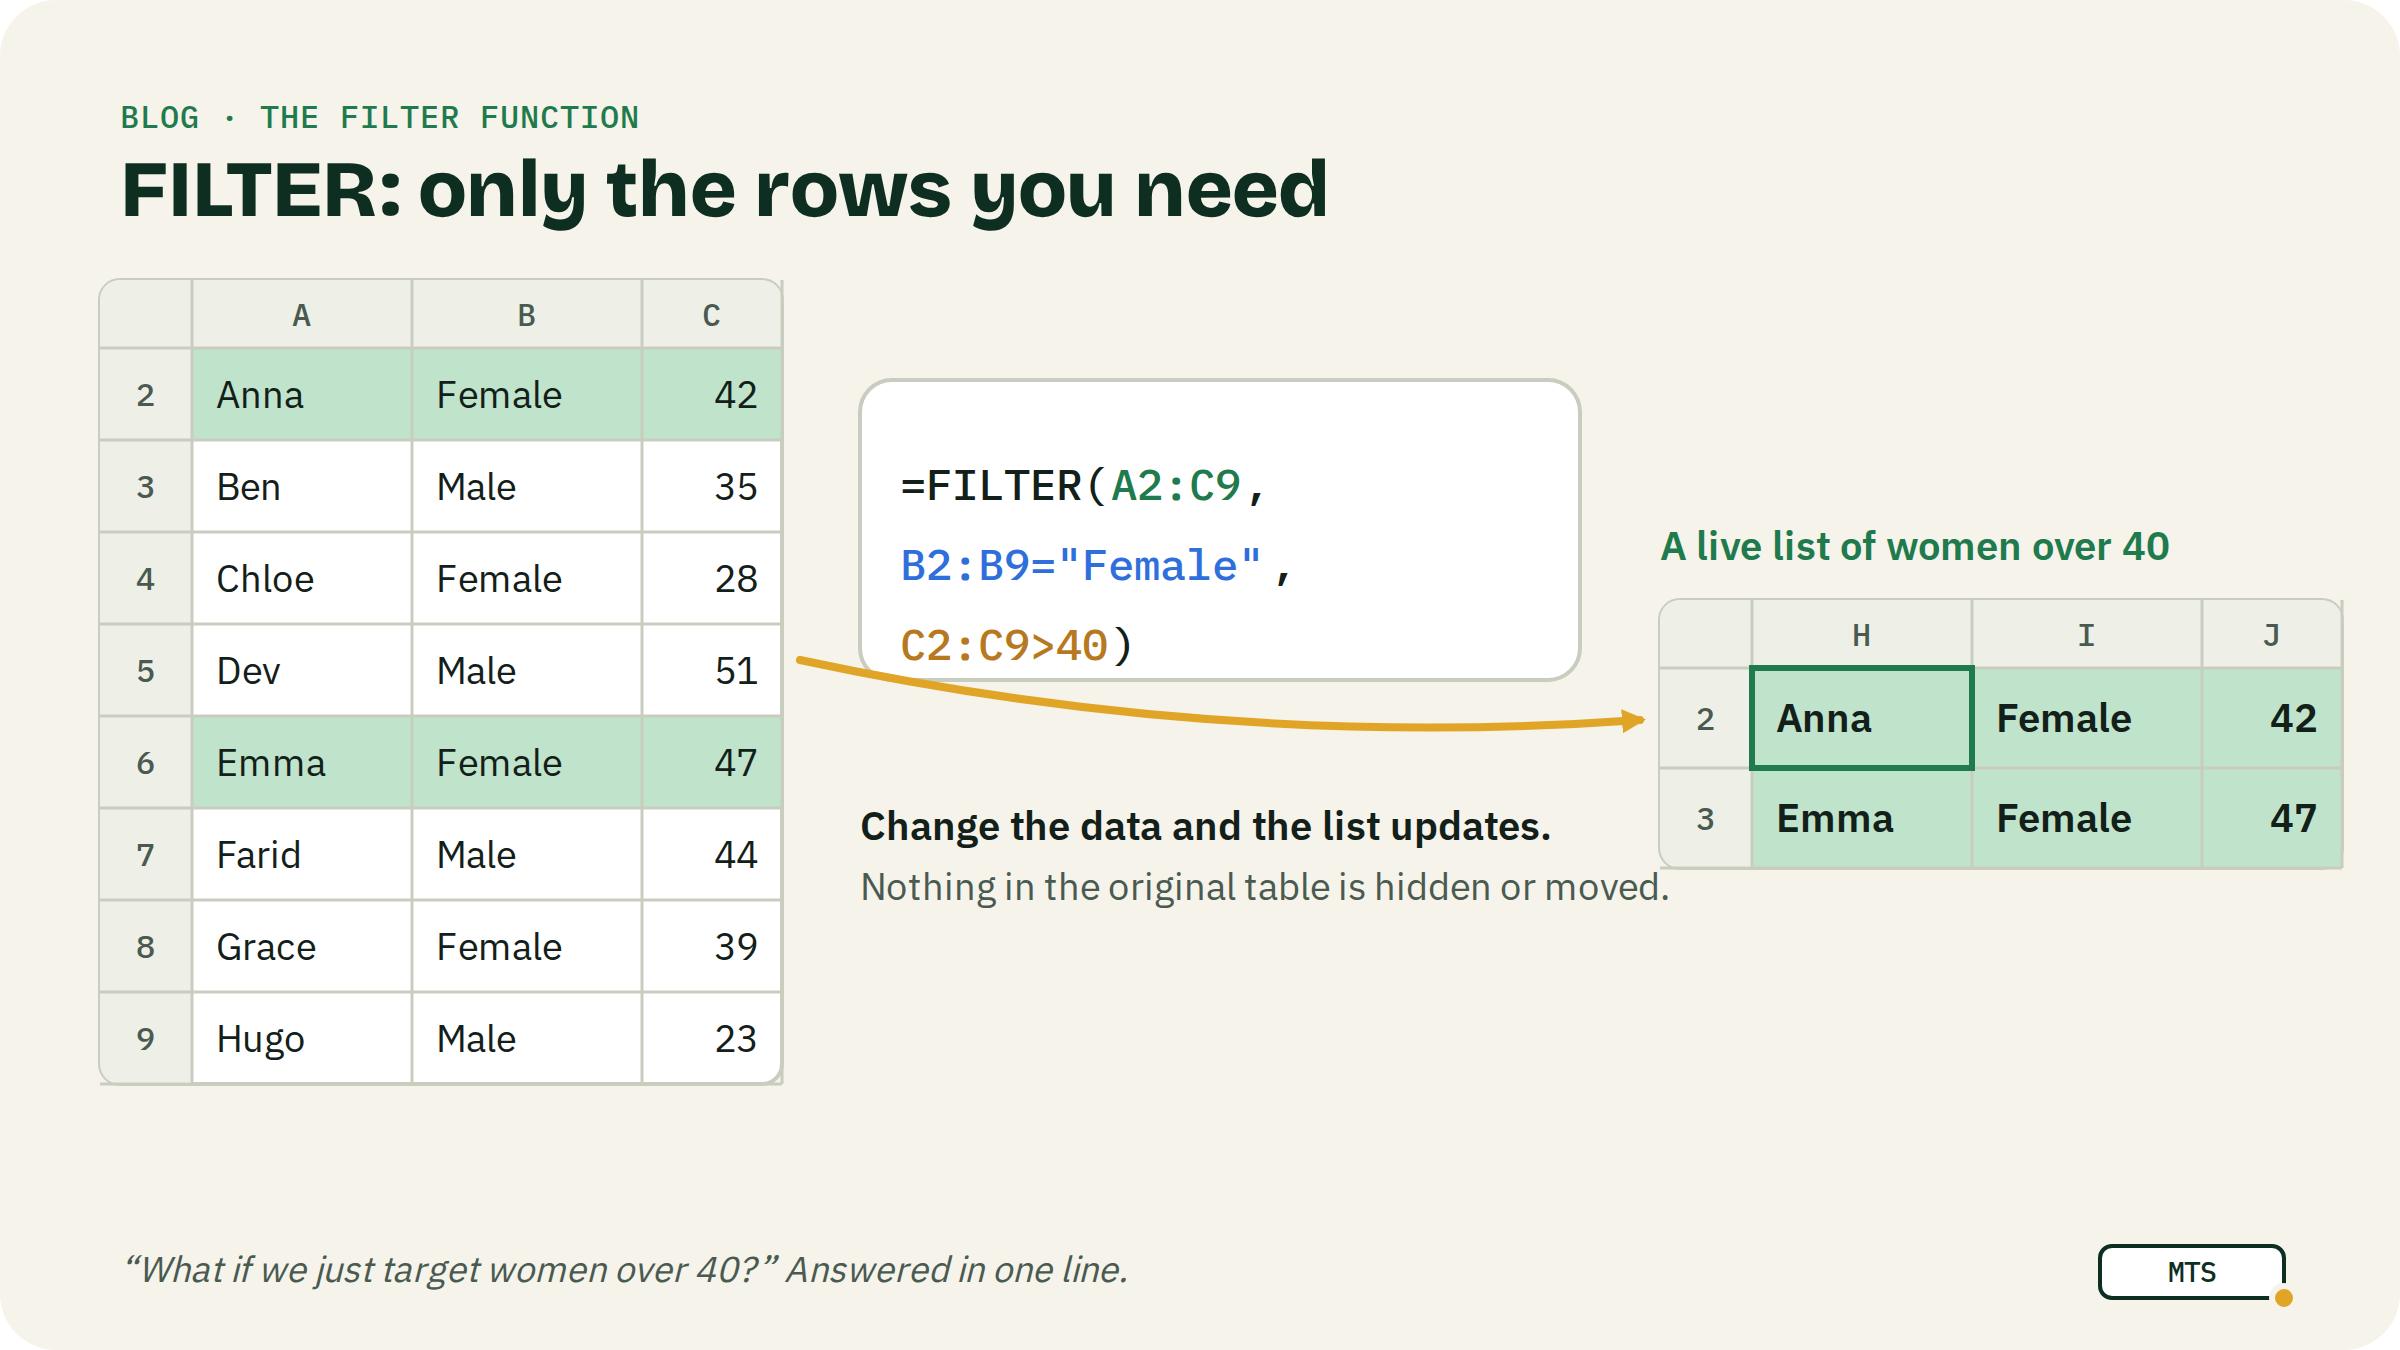
Does QUERY work in Excel? No, it is Google Sheets only. In Excel, use a PivotTable for totals, FILTER and SORT for filtering and sorting (Excel 365), or GROUPBY in newer versions of Excel 365. SUMIFS and COUNTIFS work in both.
Can QUERY pull data from another tab? Yes: =QUERY(Deals!A1:E11,"select B, sum(E) group by B",1). For another file, wrap IMPORTRANGE around the range and refer to columns as Col1, Col2… instead of letters.
Why does my result have no header, or a strange one? Set the last argument to 1 when your data has one header row. Rename aggregate headers with label.
Keep going
- Practise SUMIF for free in White Belt lesson 11, with instant feedback. It is the everywhere-version of a QUERY total.
- Next read: The FILTER function in Google Sheets: 7 examples and SUMIFS explained with 5 real examples.
Written by MasterTheSheets